Calswr - calibration - Load a calibration
 
Picswr has separate forward and reflected calibration windows / processes.
 
These are accessed via   Menu | Calibration | Forward Calibration
                                     Menu | Calibration | Reflected Calibration
 
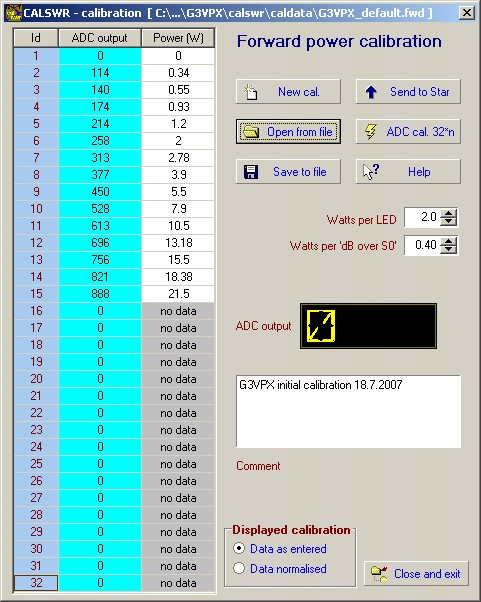
The forward calibration screen is used to illustrate the software.
(The reflected screen differs only in having a 'Mismatch watts' setting.)
 
If you are looking at this software for the first time, it would be useful to view and/or print he G3VPX default calibration information.
 
To view and print, click Menu | Calibration | Calibration summary
 
To move to the help screen on this,   click  Calibration summary
 
The calibration screen provides for the following:
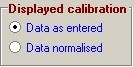
  • Create a new calibration (Data as entered)
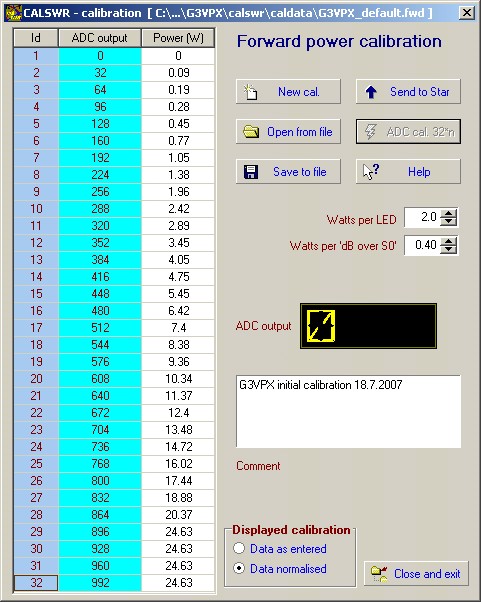
  • Normalise into 32 ADC regularly spaced output points: 0,32,64,96 etc
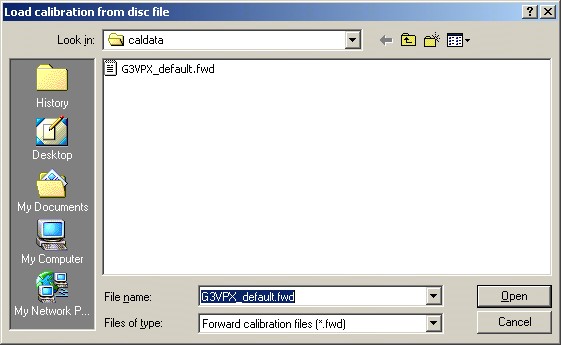
  • Save the calibration to disc file
  • Transmit the calibration to Picswr in PicAStar.
 
The processes are illustrated with screen shots:


Above is the initial appearance.
 
Loading a calibration file
 
First let's load a calibration. Click on
 
The load dialog appears. Files are restricted to .fwd files. Your latest is selected by default. If you haven't previously done a calibration then this will be G3VPX_default.fwd,  located in C:\Program files\G3VPX\Calswr\Caldata.


Click   and the calibration below will display:


This shows the fifteen calibration points that I initially entered.
The number of points and their values are constrained by PicAStar's 8.1 drive level increments which are in 1dB steps.
Note the watts per LED and watts per dB over S0 settings.
 
  • Watts per led is set to 2.0 so that the twelve LED display has range 0 to 24w.
  • 'Watts per dB over S0' is set to 0.4. Thus the S9 position on the analogue meter will correspond to 0.4 x 6 x 9 =  21.6w. ( 6dBs per S point, 9 S points). Above S9 the G6AK calibration is more compressed ... but this is dealt with by making a calibrated scale for the meter.
 
Normalising the calibration
 
Now click   or check 'Data normalised' in


Calswr has effectively 'drawn a graph' using the initial points and then produced calibration points at thirty two ADC steps of 32 units.
(32*32 - 1 = 1023 - max ADC output for a 10 bit ADC) 
The normalisation process uses linear interpolation between the entered calibration points.
These 32 power levels are stored in the Picswr PIC16F876 EPROM. They appear in the rightmost columns of the ADC calibration printout.
 
One transmit, Picswr divides the current ADC output by 32 and uses the resulting number ( n = 0 to 31)  to look up the power level. It actually also looks up the next adjacent power level (n+1) and uses simple linear interpolation between levels n and n+1 for improved accuracy.
 
Calswr's main screen LED power displays use exactly the same process with same 32 calibration points.
 
Performing your own calibration
 
Click  to clear the calibration.
 
Click here to jump to the help screen:  Calswr - do a calibration